| Overview |
| Screenshots |
| Features |
| License |
| Installation |
| Running |
| Usage |
| Questions |
| Known bugs |
| Development |
| Future plans |
| References |
| Contact |
|
|
What does it look like?
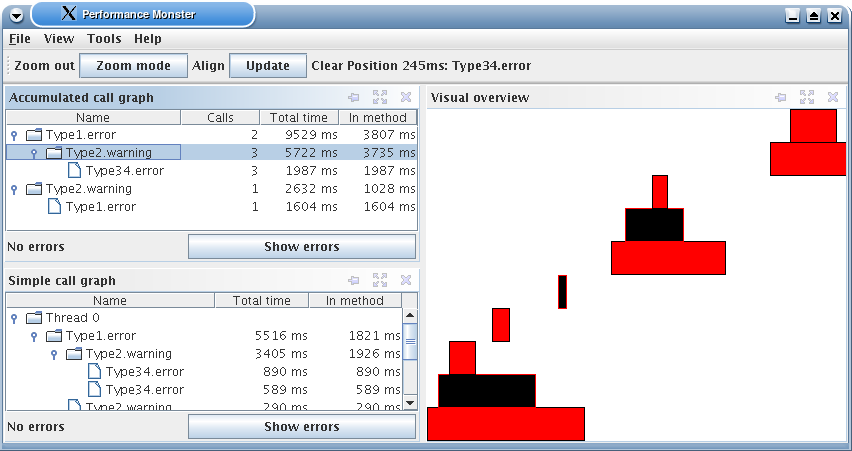
A really nice and simple GUI. Your code surrounded by "BEGIN" and "END", as described above, will be shown in PerformanceMonster's main view as colored bars. Furthermore, the log messages will be analyzed and shown as a call graph (lower left) and an accumulated call graph (upper left).
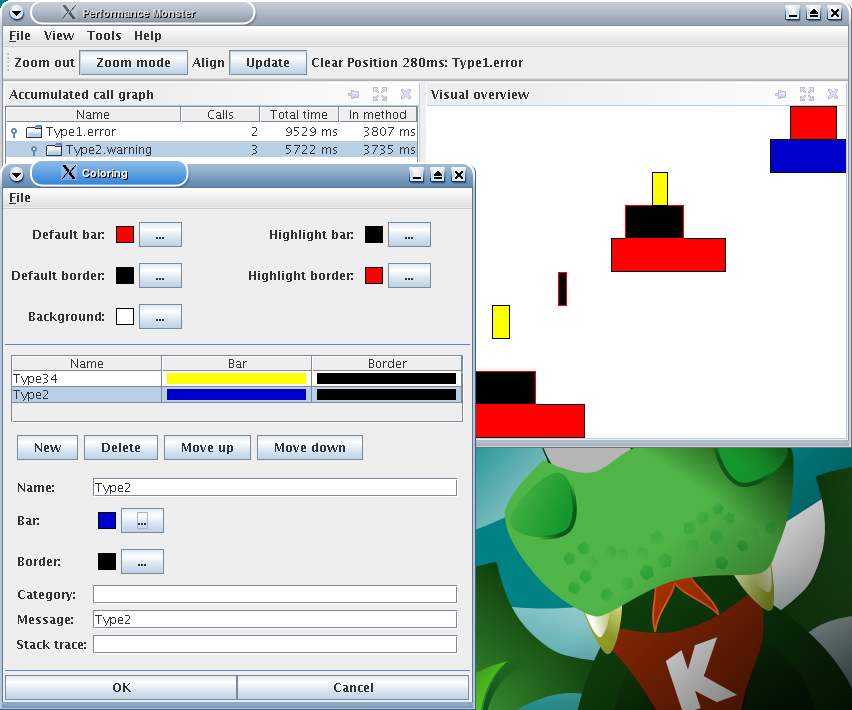
Of course, instead of having just red bars, you can add some color rules to give a better overview - for example, color very performance-critical bars red, less performance-critical bars yellow, or something:
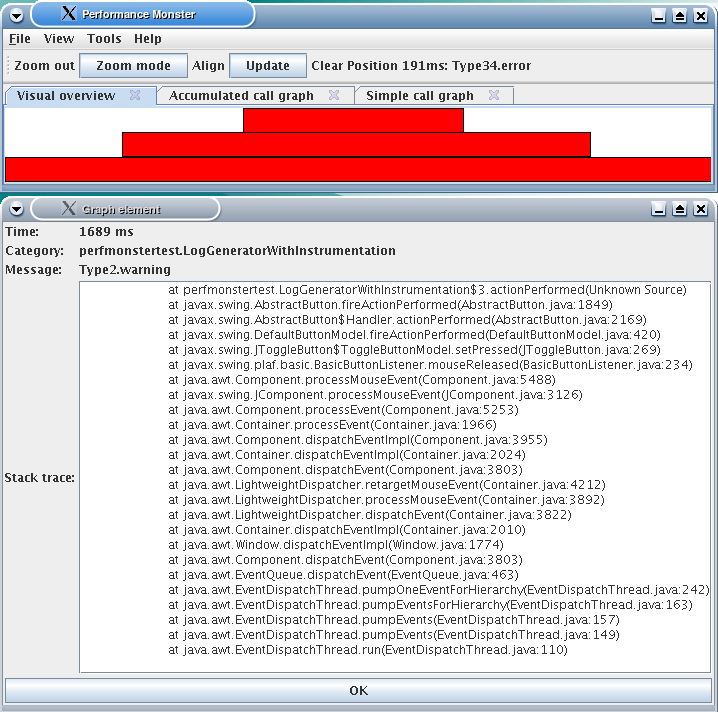
To help you drill down through the data, you can zoom in and out of the view. Furthermore, when you click on a bar, you get a lot of information about it. The most usable information is probably a stack trace. In the following screen shot, we have clicked on the bar in the middle:
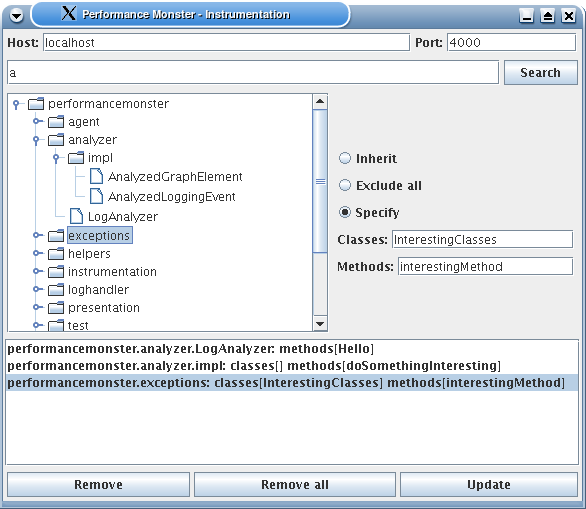
And here's the current instrumentation GUI. By using this feature of PerformanceMonster, you don't have to manually surround the performance-critical parts of your code with "BEGIN" and "END", since you can do this run-time using this GUI. (Only works with Java 5, though.)